

Part 1: With A Soft or Hard Landing, Are Growth Stocks About to Take Off?
Part 1: With A Soft or Hard Landing, Are Growth Stocks About to Take Off?
Valuations of growth stocks have come down, should you load up on shares?

As active growth investors, we take the market action day by day and level by level. We understand the market can turn on a dime and we must be ready. Likewise, it’s beneficial to take a step back and see the forest through the trees and not get lost among the daily noise.
This will be a two part breakdown:
Part 1
Recent carnage in growth stocks
Very brief introduction into Stan Weinstein’s stage analysis
Real life trade example from my friend in PayPal
Two examples I am seeing right now
Part 2
Do growth stocks really bottom before the general market? and if so:
Looking at price action, valuations, growth and narratives, are there any good setups emerging from beaten down growth that are close to entry criteria for longer term holders?
Getting Started- Part 1
The damage has been done… but is it done?
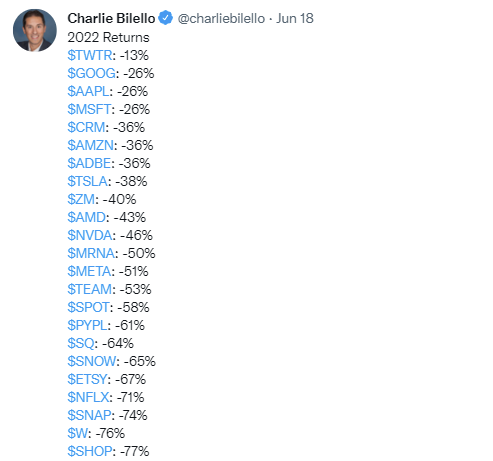
Looking at 2022, we can see many growth stocks have been nuked to the downside. Dozens of Household names are seeing breath taking drops. Shopify down over 75%, Snapchat over 70%, Nvidia getting hit to the tune of 45% and even Google and Microsoft losing a quarter of their value.
In reality, growth stocks have been stagnating or sliding for well over a year now. Two proxies we can look at is the IShares Russell 2000 growth ETF (IWO) and the ARK Innovation ETF (ARKK).
Let’s take a look at the weekly chart of IWO:
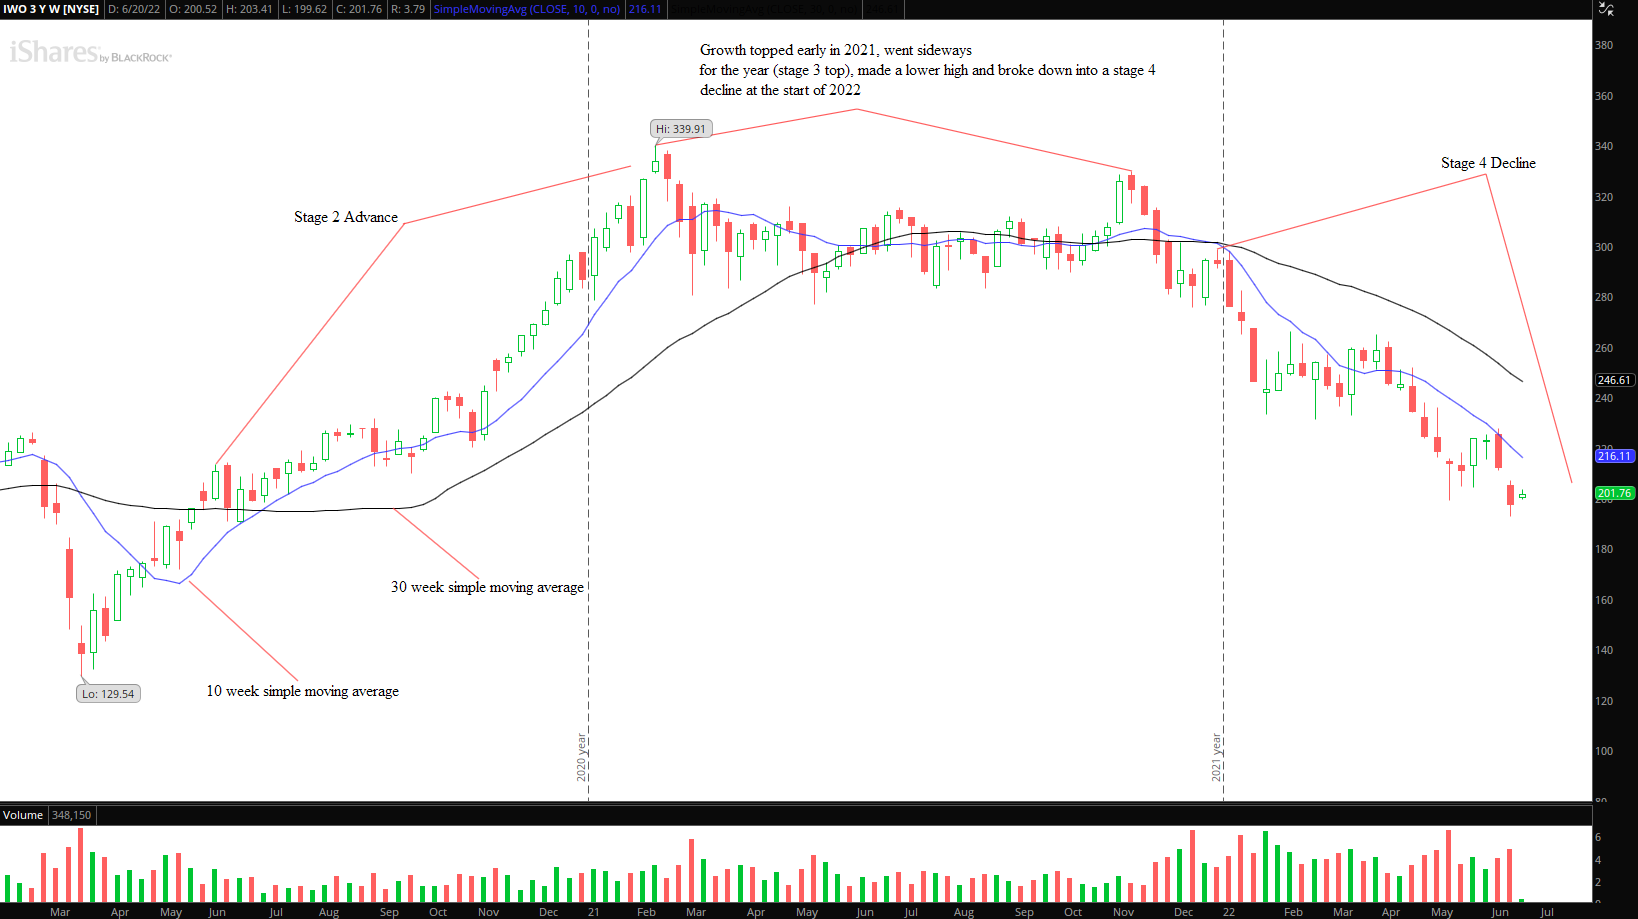
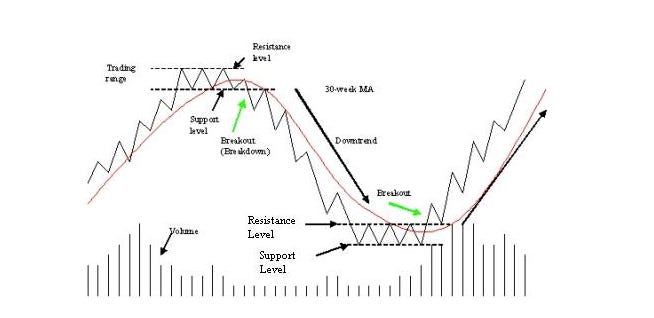
Using the model provided by Stan Weinstein, we can clearly see the stages he uses to identify different parts of a stocks price cycle. Growth stocks entered a stage 2 advance after the Covid crash, topped out and entered a stage 3 top (which could resolve higher or lower, we don’t know in stage 3 but its important to note) and eventually moved lower, entering the dreaded stage 4 decline. Below is a simple chart marking up his philosophy.
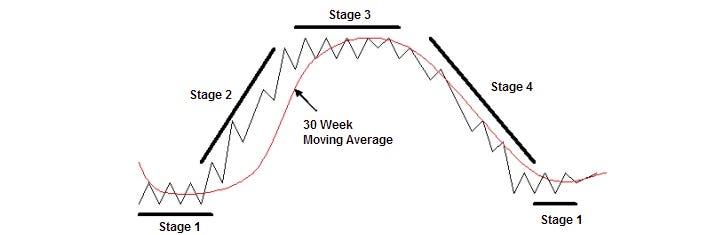
Looks similar to the IWO chart right?
The intricacies and methodology of his Stage Analysis is best explained by him. Google Stan Weinstein and Stage Analysis and venture down that path for a better understanding. Or better yet, buy his book.
What I am after is simply understanding how to enter potential stage 1 breakouts while avoiding catching a falling growth stock in a stage 4 decline. This simple understanding can save, and make you, more money than you ever imagined.
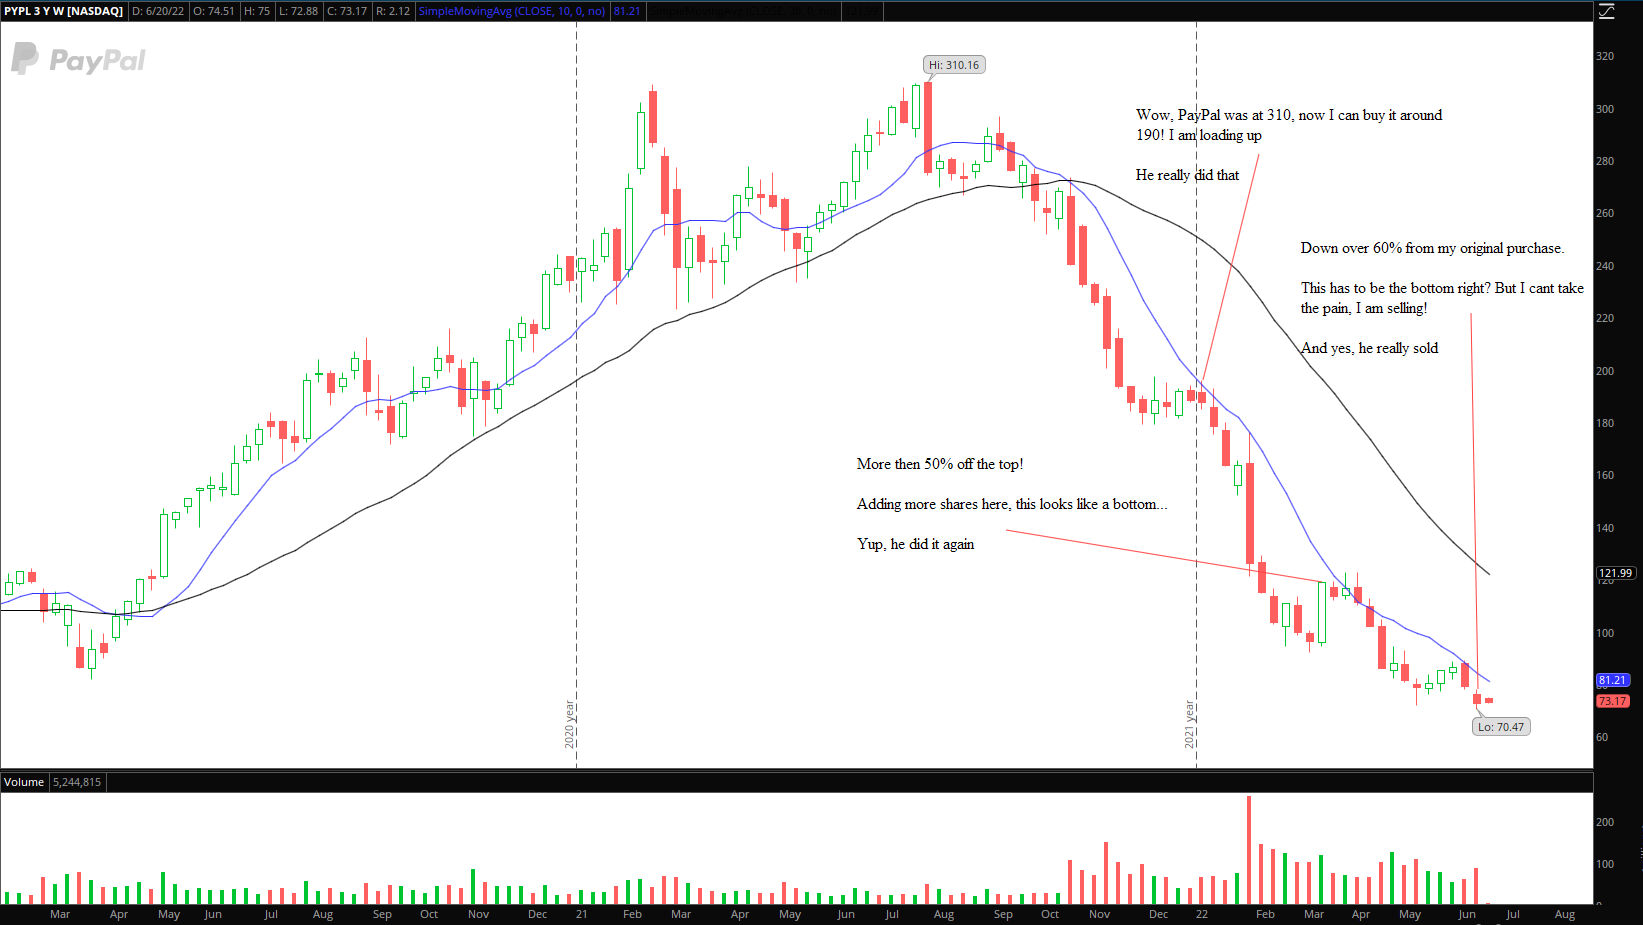
Here is a chart of PayPal. A great company (I think). My friends and I have used their services countless times. A household name with strong brand recognition. And one that cost my friend 1/3 of his investment account. Below is the chart of PayPal along with my friend who kept buying it. This is true. Don’t be like my friend.
We have all been here. I have done this. Almost everyone I know has done this at least once. I am not poking fun of my friend. But we can learn from him.
He made the cardinal sin. He put valuations and fundamentals above price and averaged down into a stock in a stage 4 decline. The price of PayPal never closed above the 10 week simple moving average, let alone anywhere close to the 30 week simple moving average (black line). If you understand price cycles, you would never have touched this stock on the way down. This is so important I can not overstate it. Take some time to really understand the bigger picture, zoom out from the forest, and don’t let yourself get caught like my friend did.
So, you ask (and so did my friend) how do we actually enter these stocks after they get crushed? Again, I would defer to Stan’s book. But below is a simple diagram.
You wait for the stock to build a base, for price to reclaim the 30 week simple moving average and for a breakout to occur.
Simple right?
The best things in life usually are.
We can use weekly stage analysis to buy, and sell stocks (either to lock in gains or to sell short)
Lets look at two examples right now that are setting up.
The first is the China Internet ETF (KWEB)
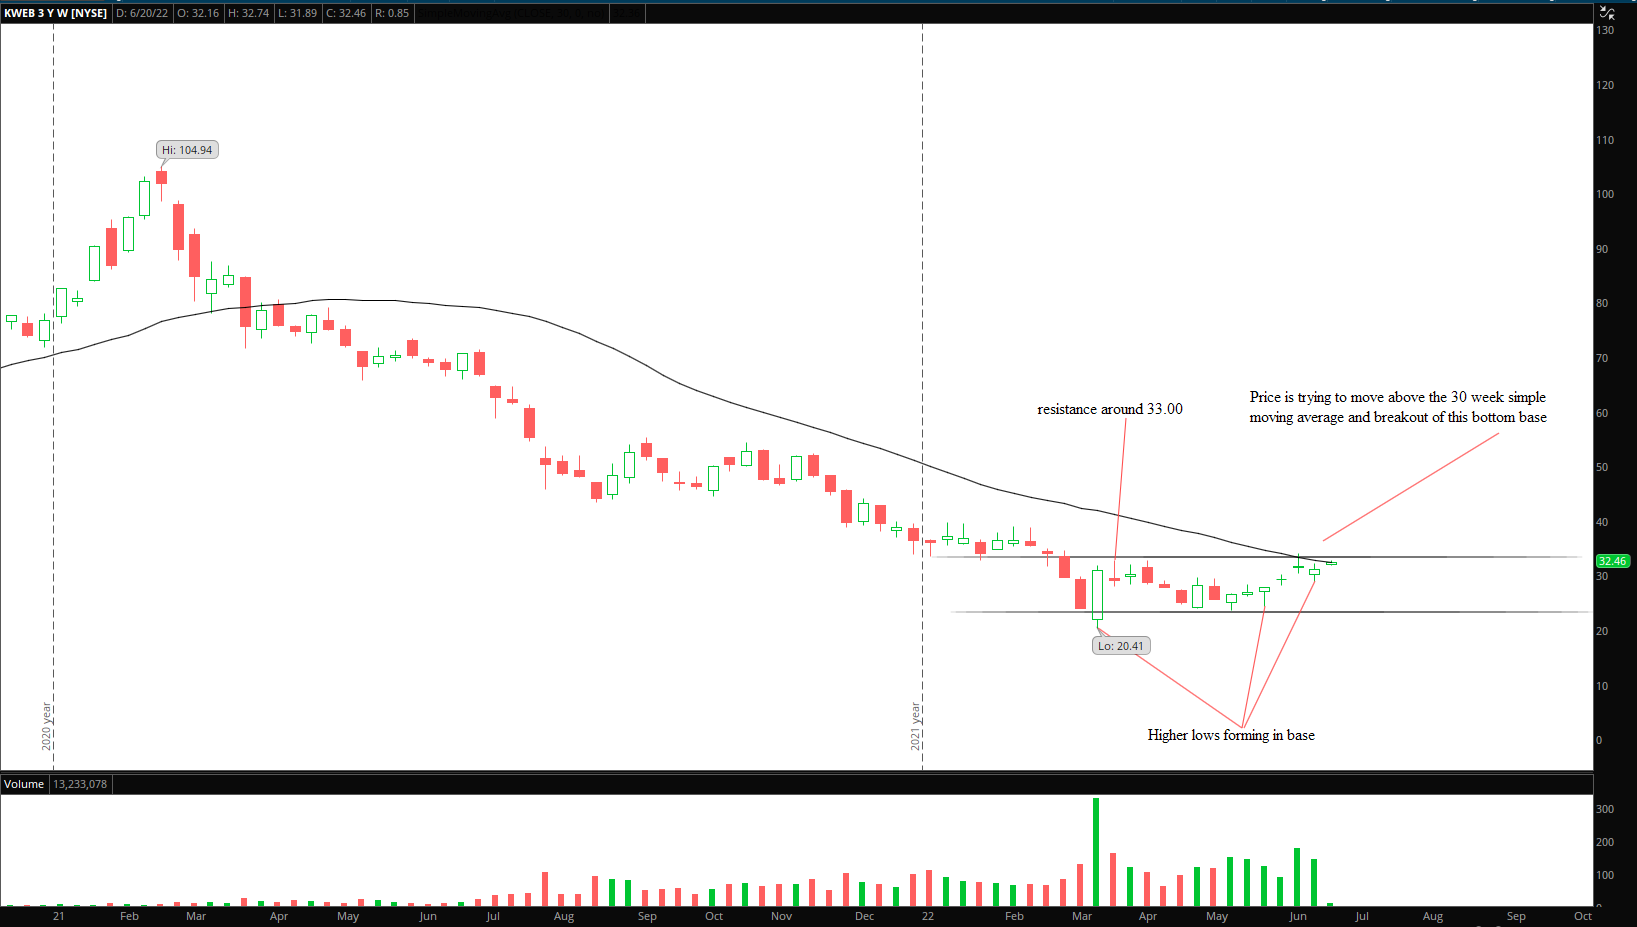
After a brutal stage 4 decline of over 70%, KWEB might be starting to form a stage 1 bottom base and about to enter a stage 2 advance. Price has made a series of higher lows while the base is building, price is trying to reclaim the 30 week simple moving average as it breaks out over resistance around 33.00. Time will tell, but this is one I want to keep my eye on.
The second is the United States Copper Index Fund (CPER)

This time on the downside. After a strong Stage 2 advance and possible Stage 3 top, is Copper entering a Stage 4 breakdown and decline?
Zooming out and looking at weekly charts is a great way to combine larger, Macro opinions with price action without catching falling knifes and getting financially (and emotionally) wrecked.
Personally, I have longer term Macro thoughts on why China Internet might be a good buy and why I am short Copper (and Wood).
Part 2 will have a heavy focus on growth stocks. I will be looking for longer term ideas utilizing some of the methodologies outlined here.
I hope you liked this introduction. I wanted to explain somewhat of a baseline before Part 2
As always, thanks for reading and good luck out there
—NS